Shop on Lazada
Excel products

EXCEL Pure Detergent Powder with Fabric Softener/ Conditioner and Active Whitener (Red Pack) - 1 Kilogram
₱75.00₱85.00

EXCEL Fuel Lighter Refill 130 or 200ml SOLD Separately
₱195.00₱200.00

FLUORESCENT LED LIGHT 96W/48W/36W/27W
₱525.00₱675.00

Excel Staple Wire No. 35 BIG
₱33.00
Buy on Lazada
POS Journal / Cash Register Tape 76mm x 70mm (1 Pack = 10 Rolls)
₱250.00₱450.00
1 PLY POS Journal Tape / Cash Register Tape 76mm x 70mm (1 Box = 50 Rolls)
₱1,299.00₱2,599.00
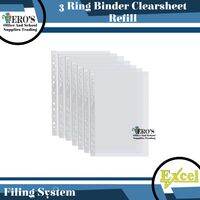
3 Ring Binder Plastic Refill Clearsheet Sheet Protector 100s (NO BOX)
₱409.00
Buy on Lazada![[WHOLESALE] 2 PCS Colored Masking Tape Big core](https://ph-live.slatic.net/p/bdceaf502266099736fe575b8e3b0773.png_200x200q80.jpg)
[WHOLESALE] 2 PCS Colored Masking Tape Big core
₱132.00
Buy on LazadaAbout Excel
Microsoft Excel, commonly referred to as Excel, is a spreadsheet application developed and marketed by Microsoft. Designed for organising, calculating, analysing, visualising, and presenting data within a grid of rows and columns, it stands as one of the most widely recognised spreadsheet programmes globally. Excel is extensively utilised across business, education, finance, accounting, science, government, and personal productivity sectors in the Philippines and internationally.1
Overview
| Information | Details |
|---|---|
| Name | Microsoft Excel |
| Developer | Microsoft |
| Type | Spreadsheet / data-analysis software |
| Initial release | September 30, 1985 |
| First platform | Apple Macintosh |
| Windows release | November 19, 1987 |
| Current ecosystem | Microsoft 365, Windows, macOS, web, iOS, Android |
| Main file formats | .xlsx, .xlsm, .xlsb, .xls |
| Parent company | Microsoft |
| Related Microsoft products | Word, PowerPoint, Outlook, OneDrive, SharePoint, Teams, Power BI |
Microsoft officially describes Excel as a comprehensive tool for working with numbers and data, encompassing data entry, calculations, charting, trend identification, and analysis.1
History
Origins
The development of Excel traces back to Microsoft’s earlier spreadsheet product, Multiplan, and the intensifying competition in the spreadsheet software market during the early 1980s. In 1983, Microsoft commenced development of a new spreadsheet application under the codename “Odyssey”.2
During this period, Lotus 1-2-3 was a dominant spreadsheet application for personal computers. Microsoft sought to create a product that could compete more effectively, particularly by leveraging graphical user interfaces.
Macintosh release
Microsoft announced Excel for the Macintosh in 1985, with commercial shipping commencing on September 30, 1985. This release was significant as it combined spreadsheet calculations with graphical presentation capabilities and an on-sheet database.2
The Macintosh version helped establish Excel’s identity as a visually oriented spreadsheet application, distinguishing it from many command-driven programmes available at the time.
Windows release
Excel for Windows was announced in October 1987 and shipped on November 19, 1987.2
This version became increasingly important as the Microsoft Windows operating system gained popularity. Excel subsequently emerged as a major competitor to Lotus 1-2-3 and eventually became one of Microsoft’s most critical productivity applications.
Microsoft Office
Excel later became a core component of Microsoft Office, alongside applications such as Word and PowerPoint. This integration was instrumental in establishing the Office suite as a premier productivity software platform.
Over subsequent decades, Excel evolved from a traditional spreadsheet programme into a broader platform for data analysis, visualisation, financial modelling, automation, business reporting, and collaboration.
Functionality
At its most basic level, Excel consists of a grid of cells organised into rows and columns. A cell may contain text, numbers, dates, formulas, or other data types. Multiple worksheets can be housed within a single workbook.1
For example:
A B C

 1 Product Price Units

 2 Laptop $900 10

 3 Monitor $300 15

 4 Keyboard $80 25
Excel can calculate values derived from this data:
Total Revenue = Price × Units
Using a formula such as:
=B2*C2
Excel automatically computes the result.
Major features
Formulas and functions
A defining feature of Excel is its formula engine, which allows users to create calculations ranging from simple arithmetic to sophisticated financial, statistical, logical, and engineering models.
Common functions include:
SUMAVERAGECOUNTIFSUMIFSUMIFSCOUNTIFXLOOKUPVLOOKUPINDEXMATCHTEXTDATEFILTERUNIQUE
Current Excel documentation specifically highlights functions such as XLOOKUP, VLOOKUP, and IF among its primary tools.1
Data organisation
Excel facilitates the organisation of large volumes of information through:
- Tables
- Sorting
- Filtering
- Conditional formatting
- Data validation
- Drop-down lists
- Named ranges
- Freeze panes
- Duplicate detection
- Data-cleaning tools
These capabilities make Excel useful not only for mathematical calculations but also for maintaining structured datasets.
Charts and visualisation
Excel can transform spreadsheet data into various visual representations, including:
- Column charts
- Bar charts
- Line charts
- Pie and doughnut charts
- Area charts
- Scatter plots
- Histograms
- Stock charts
- Combo charts
Microsoft also provides automatic chart recommendations based on the underlying data.1
PivotTables
PivotTables represent one of Excel’s most significant data analysis features. They enable users to summarise large datasets by dimensions such as:
- Product
- Region
- Employee
- Month
- Customer
- Department
For instance, thousands of sales transactions can be transformed into a summary showing:
“`
Region Revenue
North $1.2M
South $980K
East $1.5M
West $1.1M
“`
PivotCharts can then visualise this summarised information. Microsoft continues to provide dedicated tools for both PivotTables and PivotCharts.1
Data analysis
Excel supports increasingly sophisticated data analysis workflows, including importing, transforming, filtering, summarising, and visualising datasets. It is frequently employed for:
- Financial analysis
- Budgeting
- Forecasting
- Sales analysis
- Inventory management
- Statistical analysis
- Business reporting
- Project tracking
- Research
- Operations management
Automation
Repetitive tasks can be automated in Excel through technologies such as VBA (Visual Basic for Applications), Office Scripts, formulas, and other Microsoft 365 automation capabilities.
VBA has historically made Excel popular among advanced business users by enabling the creation of macros that automate repetitive spreadsheet operations.
Excel and Microsoft 365
Modern Excel is no longer confined to a locally installed desktop application. Microsoft distributes Excel across several environments, including:
- Excel for Windows
- Excel for macOS
- Excel for the web
- Excel for iOS
- Excel for Android
The current product offering emphasises cloud storage and real-time collaboration.3 Consequently, Excel functions as part of the broader Microsoft 365 ecosystem, with files stored and synchronised via Microsoft’s cloud services.
Excel and artificial intelligence
A significant modern development in Excel is the integration of Microsoft Copilot. Microsoft currently describes Copilot in Excel as an AI assistant capable of aiding users with tasks such as:
- Creating or suggesting formulas
- Formatting data
- Identifying trends
- Finding anomalies
- Summarising information
- Generating insights
- Assisting with data analysis
This integration brings AI assistance directly into spreadsheet workflows.3 Historically, users were required to possess knowledge of appropriate formulas or analytical techniques; AI assistance now enables users to formulate analyses using natural language instructions.
File formats
The modern default Excel format is Office Open XML, most commonly represented by .xlsx. Other important formats include:
.xlsm— Excel workbook containing macros.xlsb— Excel Binary Workbook.xls— Older Excel workbook format.csv— Comma-separated values, commonly imported into Excel
It is important to note that CSV is not an Excel-native workbook format. It stores tabular text data and does not preserve Excel-specific features such as formulas, formatting, charts, or multiple worksheets.
Usage contexts
Excel maintains an exceptionally broad user base across various sectors.
Business
Businesses utilise Excel for budgets, sales reports, financial models, business forecasts, employee schedules, inventory management, customer lists, management reports, and performance tracking.
Finance and accounting
Excel is particularly influential in financial work, commonly used for financial statements, cash-flow analysis, valuation models, investment analysis, budgeting, tax calculations, and financial forecasting.
Education
Students and educators use Excel for mathematics, statistics, laboratory data, grade tracking, research, charting, and data exercises.
Science and research
Researchers employ Excel to organise experimental observations, perform calculations, produce graphs, and conduct basic statistical analysis.
Personal use
Individuals use Excel for personal budgets, expense tracking, household inventories, travel planning, lists, schedules, calculators, and personal financial models.
Factors influencing adoption
Excel’s success stems partly from its combination of simplicity and depth. A beginner may use Excel as a simple table:
Name | Age | City
Conversely, an advanced user can construct a multi-sheet financial model containing thousands of formulas, automated processes, statistical analyses, dashboards, and data connections.
This creates an unusually wide spectrum of users:
Beginner → Office worker → Analyst → Accountant → Financial modeller → Data professional → Developer
The same application serves all these groups effectively.
Strengths
Flexibility
Excel adapts to an enormous range of tasks, allowing users to create custom structures rather than working within fixed database or application interfaces.
Powerful calculations
Its formula and function system facilitates relatively sophisticated mathematical, statistical, logical, and financial calculations.
Visualisation
Users can transition relatively easily from raw data to tables, charts, dashboards, and reports.
Familiarity
Having been used for decades, Excel is a common skill requirement in offices and educational institutions.
Ecosystem
Integration with Microsoft 365, OneDrive, SharePoint, Teams, Power BI, and other Microsoft technologies expands its utility. The current Excel offering emphasises collaboration and cloud-based workflows.3
Limitations
Despite its capabilities, Excel is not a universal replacement for databases or dedicated analytical systems. Common limitations include:
- Human errors in formulas
- Difficulties maintaining very complicated workbooks
- Limited database-style data integrity
- Version-control problems in some workflows
- Performance issues with extremely large or complex models
- Risk of accidental changes
- Difficult-to-maintain VBA macros
- Spreadsheet structures that can become difficult to audit
For very large or highly structured datasets, organisations may instead utilise databases, specialised analytics platforms, or business intelligence systems.
Role in Microsoft’s product family
Excel is one of three historically central Microsoft Office productivity applications:
- Microsoft Word → Documents and word processing
- Microsoft Excel → Spreadsheets and data
- Microsoft PowerPoint → Presentations
In modern Microsoft 365, Excel is increasingly connected to other services and applications, functioning as part of a larger productivity and data analysis ecosystem rather than merely a standalone spreadsheet programme.
Brand identity
The name Excel has become closely associated with spreadsheets and tabular data. In everyday language, “an Excel file” often refers to a spreadsheet even when the file may technically be in another format.
Visually, the Excel brand is associated with a green colour scheme and an X-shaped icon, consistent with Microsoft’s modern Office application branding. The product’s long history has made “Excel” almost synonymous with spreadsheet software in many workplaces.
Evolution of Excel
| Period | Development |
|---|---|
| 1983 | Excel project begins under the codename Odyssey |
| 1985 | Excel launches for Macintosh |
| 1987 | Excel for Windows is announced and shipped |
| 1990s | Excel becomes a major competitor to Lotus 1-2-3 |
| 1990s–2000s | Excel becomes a central component of Microsoft Office |
| 2007 | Modern .xlsx file format introduced with Office Open XML |
| 2010s | Cloud connectivity, Power Query, Power Pivot, improved collaboration and analytics become increasingly important |
| 2020s | Excel becomes increasingly integrated with Microsoft 365, cloud collaboration, and AI |
| 2026 | Excel continues as Microsoft’s major spreadsheet and data-analysis application |
Microsoft’s historical material identifies 1985 as the beginning of Excel’s commercial history and notes the project’s earlier Odyssey development phase.2
Summary
Microsoft Excel is a digital spreadsheet that evolved into a general-purpose data analysis and productivity platform.
At a basic level:
Rows + columns + cells + formulas = spreadsheet
At an advanced level:
Data + formulas + automation + visualisation + analysis + collaboration + AI = modern Excel
This evolution distinguishes Excel: originating as a spreadsheet application in the 1980s, it has grown into a tool used for everything from student homework and household budgets to corporate financial models and large-scale business analysis.
Official resources
- Microsoft Excel — official product page
- Excel Help & Learning — Microsoft’s documentation and tutorials
- Microsoft’s history of Excel — historical background on Excel’s development